Executive Summary for KPIs and OKRs in Manufacturing
Manufacturers rely on KPIs to monitor operational performance—and OKRs to drive strategic improvement—but most organizations struggle to use the two systems together effectively – KPIs and OKRs in Manufacturing. This article breaks down the core differences between KPIs and OKRs, explains how each framework supports manufacturing performance, and shows how to integrate them into one complete measurement system. You’ll learn how to identify the right KPIs, set meaningful OKRs, and use them to create a continuous improvement cycle that strengthens quality, delivery, cost, safety, and workforce performance. The goal: transform measurement from a reporting exercise into a strategic engine for predictable, scalable results.

Article Body
Every manufacturing leader faces the same challenge: how do you know if performance is improving, and how do you actually drive that improvement? You need visibility into what’s happening now and a clear plan for what needs to change next. That’s where two powerful frameworks come in. Key Performance Indicators (KPIs) show you how things are running today. Objectives and Key Results (OKRs) tell you what you’re going to improve this quarter. Used together, they transform manufacturing performance from reactive firefighting to strategic progress.
Related Performance Topics for Manufacturers
-
- Leading KPIs: The Early Warning Signals Every Plant Manager Needs
- How to Organize Manufacturing KPIs: 5 Categories Every Plant Manager Needs
- How to Align Manufacturing KPIs with Business Strategy: A Step-by-Step Guide
- Manufacturing Data Quality Checklist: 7 Steps to Ensure Accurate KPIs
- How to Write Manufacturing OKRs: Examples and Templates That Work
- How to Cascade OKRs in Manufacturing: From Strategy to Shop Floor
- Manufacturing OKR Review Cadence: Weekly, Monthly, and Quarterly Meeting Guide
The problem is that most manufacturers treat these as competing approaches or use them incorrectly. Some track dozens of KPIs but never improve anything. Others set inspirational OKRs that disconnect from real operational metrics. The most effective approach is “both and” rather than “either or”. KPIs flag the problems. OKRs solve them. This article cuts through the confusion. You’ll learn the core difference between KPIs and OKRs, how to use each one effectively in manufacturing, and how to integrate both into a complete performance system that actually changes results.

Understanding the Core Difference
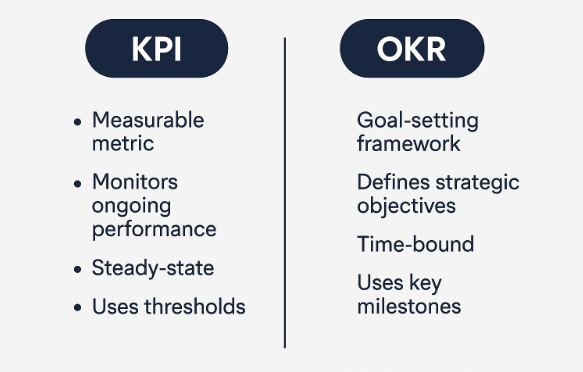
KPIs are specific, usually numeric, measures that show how a process, team, or organization is performing against a target. They monitor the steady state. Think of them as the instrument panel in your car: fuel level, speed, engine temperature. Each one tracks a critical variable you need to keep within acceptable ranges.
OKRs are a goal-setting framework that combines a qualitative Objective (what you want to achieve) with a small set of quantitative Key Results (how you’ll measure progress). They drive time-bound change. Think of OKRs as your GPS navigation: they tell you where you’re going and show if you’re getting closer.
The fundamental difference is purpose. KPIs monitor and evaluate ongoing performance. They’re continuous and often conservative, focused on staying on target. OKRs drive focused improvement and alignment. They’re time-limited and deliberately ambitious, pushing for meaningful change over a defined period.
This distinction matters because it changes how you diagnose and prioritize. KPIs help you see where performance is drifting from acceptable ranges. A rising scrap rate or falling schedule attainment signals that something needs attention. OKRs help you decide what to improve and by how much. “Reduce first-pass yield defects from 8% to 4% by Q2” creates a focused effort on a specific improvement.
KPIs in Manufacturing Context
Effective manufacturing KPIs organize around five strategic themes: Safety, Quality, Delivery, Cost, and People. This framework ensures you’re monitoring the full spectrum of manufacturing performance, not just output and efficiency.
For Safety and People, track recordable incident rates, near-misses, safety training completion, employee turnover, and absenteeism. These are leading indicators of workforce health and operational stability. Manufacturing facilities with strong safety KPIs consistently outperform those that treat safety as compliance paperwork.
Quality metrics include first-pass yield, scrap rate, rework percentage, customer returns, and defect rates by category. Quality KPIs should distinguish between internal detection and external escapes because catching defects before shipment costs far less than field failures.
Delivery and Flow metrics include on-time delivery percentage, production schedule attainment, order cycle time, and work-in-process inventory turns. These show how well your manufacturing operation serves customer commitments and how smoothly material flows through your facility.
The key is selectivity. Research consistently shows that manufacturers should track five to ten core KPIs at each level: plant level, department level, and line level. More than that, and you dilute focus. Fewer and you miss critical indicators. The specific KPIs vary by facility, but the principle holds: measure what matters, ignore the rest.
Best practices include tying every KPI to a strategic objective, using visible displays that update frequently, establishing clear ownership for each metric, and creating a regular rhythm for KPI review and action planning. KPIs without action protocols become wallpaper – visible but ignored.
Understanding leading versus lagging indicators is also important. Lagging KPIs like scrap rate and on-time delivery show results after they’ve happened. Leading KPIs like equipment setup time and preventive maintenance completion predict future performance and give you time to intervene before problems occur.

OKRs in Manufacturing Context
OKRs are increasingly common in manufacturing for driving cross-functional improvement initiatives. Unlike KPIs that monitor steady-state operations, OKRs create time-bound focus on strategic priorities that require deliberate change.
A manufacturing OKR might look like this:
Objective: Eliminate bottlenecks to increase production capacity
- Key Result: Increase Line 3 throughput from 850 to 1,100 units per shift by June 30
- Key Result: Reduce average changeover time on packaging equipment from 45 minutes to 20 minutes
- Key Result: Achieve 85% Overall Equipment Effectiveness on all critical bottleneck machines
This OKR connects a strategic goal (increase capacity) to specific, measurable outcomes with a defined timeframe. The Key Results are ambitious but achievable, requiring focused effort and likely some process changes or capital improvements.
Manufacturing OKRs are most effective when they flow from the company’s overall strategy down to plant operations and then to departmental initiatives. For example, the company might set an OKR focused on increasing market share. The plant would then interpret that into capacity expansion goals. Individual departments develop OKRs that contribute to achieving that capacity increase.
Common manufacturing OKR themes include reducing lead times, improving quality metrics, increasing equipment reliability, developing workforce capabilities, implementing new technologies, and improving supply chain resilience. The key is choosing objectives that require coordinated improvement across multiple areas, not just executing existing processes better.
Manufacturing OKRs typically run on quarterly cycles, though some organizations use monthly cycles for tactical improvements and annual cycles for strategic transformations. The quarterly rhythm matches many manufacturing planning cycles and provides enough time to see results from improvement initiatives.
The Integration Strategy: Using KPIs and OKRs Together
The real power comes from using KPIs and OKRs as complementary tools in an integrated performance system. KPIs identify where you need to improve. OKRs define what you’re going to do about it.
Here’s how this works in practice. Your quality KPI dashboard shows that first-pass yield has declined from 94% to 87% over three months. That’s your signal. Investigation reveals the root cause: variability in incoming material specifications from a new supplier. Now you create an OKR:
Objective: Restore and exceed previous quality performance
- Key Result: Increase first-pass yield from 87% to 96% by end of Q2
- Key Result: Implement incoming inspection protocol that catches 98% of out-of-spec material before production
- Key Result: Reduce supplier defect rate from 8% to 2% through enhanced quality agreements
During the OKR period, you continue monitoring your quality KPIs to track progress and identify any new issues. When you achieve the OKR, that improved performance becomes the new baseline that your KPIs monitor going forward.
This creates a cycle of continuous improvement: KPIs reveal problems, OKRs drive solutions, new KPI baselines lock in gains, repeat.
The integration strategy also helps with resource allocation. You can’t improve everything at once. OKRs force you to choose which KPI gaps matter most right now and deserve focused improvement effort. Everything else you manage through standard operational discipline.
Strategy maps help visualize these connections. They show how operational KPIs link to strategic objectives, and how specific OKRs target the critical gaps between current and desired performance.
Common Mistakes to Avoid
The most common mistake is treating every metric as a KPI. Not everything worth measuring deserves dashboard space. Ask whether the metric drives decisions or actions. If not, it’s data, not a KPI.
Another mistake is setting OKRs that are really just targets for existing KPIs. “Maintain 95% on-time delivery” is not an OKR—it’s business as usual. A real OKR would be “Reduce order fulfillment cycle time from 8 days to 4 days” which requires process changes, not just executing better.
Many manufacturers also fail to connect OKRs to actual operational reality. The executive team sets inspiring objectives about innovation and customer centricity. The plant floor has no idea how those translate to their daily work. Effective OKR cascading ensures every level understands how their objectives contribute to the company strategy.
Setting too many OKRs simultaneously is another pitfall. Organizations that try to run 15 OKRs at once effectively have zero OKRs because focus gets diluted. Three to five company-level OKRs per quarter, cascading to similar numbers at each organizational level, maintains strategic focus.
The opposite mistake is also common: tracking 40 KPIs but setting no OKRs. You monitor everything but improve nothing. KPIs without OKRs create what looks like accountability but is really just measurement theater.
Finally, many organizations fail to review and adjust. They set KPI targets in January and never revisit them. They establish quarterly OKRs and don’t check progress until the quarter ends. Effective performance management requires weekly OKR check-ins. And monthly KPI business reviews with accountability for results.
Implementation: Getting Started
If you’re starting from scratch, begin with KPIs. You need visibility into current performance before you can set meaningful improvement objectives. Identify the five to ten metrics that matter most to your strategic goals. Establish baselines. Create visible displays. Assign owners. Build a monthly review rhythm.
Once you have three months of stable KPI data, look for the gaps. Where is performance consistently below target? Where is variability too high? Where are you losing money, missing deliveries, or risking safety? These gaps become candidates for OKRs.
Choose one or two gaps that matter most—preferably ones that align with current strategic priorities. Frame them as OKRs with clear objectives and measurable key results. Assign ownership. Create a quarterly rhythm of setting, tracking, and reviewing OKRs.
As you gain experience, you’ll develop more sophisticated approaches. You might use the Hoshin Kanri approach, where objectives cascade down, and feedback flows up to refine targets. You might implement advanced KPI analytics that predict when metrics will go out of range before it happens. You might link OKRs to continuous improvement initiatives and lead transformation efforts.
The sophistication comes with practice. Start simple: measure what matters, improve what’s broken, and build from there.
The Performance Equation Framework Connection
Here’s where this connects to broader performance improvement principles. The Performance Equation Framework demonstrates that 75-85% of performance problems stem from environmental factors—unclear expectations, lack of tools and resources, conflicting priorities, inadequate feedback, misaligned consequences—not from individual capability or motivation gaps.
KPIs and OKRs are environmental interventions. They clarify expectations (what good performance looks like), provide feedback (how you’re doing against those expectations), and focus resources (what deserves improvement effort). When used well, they address the environmental causes of performance gaps rather than defaulting to the assumption that people need more training.
Consider a plant with poor on-time delivery performance. The training-focused response is to send planners to a scheduling workshop. The environmental response is to examine whether planners have accurate lead-time data, clear priority rules, real-time visibility into work center capacity, and the authority to expedite critical orders. KPIs reveal the problem. Root cause analysis identifies the environmental barriers. OKRs drive systematic removal of those barriers.
This is why measurement systems matter so much. They’re not just scorecards. They’re diagnostic tools that help you see whether your manufacturing environment supports or undermines the performance you need. Fix the environment, and performance follows.
Key Takeaways
KPIs and OKRs serve different purposes. KPIs monitor ongoing performance and flag problems. OKRs drive time-bound improvement and strategic alignment. You need both.
Less is more. Track five to ten core KPIs at each organizational level. Run three to five OKRs per quarter. More than that dilutes focus and reduces impact.
Make it visible and actionable. KPIs need clear targets, frequent updates, and ownership. OKRs need regular check-ins and accountability for progress. Without visibility and action, measurement becomes theater.
Connect to strategy. Every KPI should link to a strategic objective. Every OKR should address a strategic gap. If you can’t explain why a metric matters, you probably don’t need it.
Create a rhythm. Weekly OKR progress reviews. Monthly KPI business reviews. Quarterly OKR planning cycles. Regular rhythms build discipline and accountability.
Fix the environment, not just the people. When KPIs go red, look for environmental barriers before assuming skill gaps. Most performance problems are system problems, and measurement helps you see them.
Need Help Implementing KPIs and OKRs in Your Manufacturing Operation?
Performance on Purpose LLC specializes in helping manufacturers build performance measurement systems that actually drive improvement. We can help you identify the right KPIs for your strategic priorities, design OKRs that cascade from strategy to shop floor, and create the environmental supports that enable consistent high performance.
Our approach is grounded in the Performance Equation Framework: we focus on fixing the environment, not just training the people. Contact us to learn how we can help you transform measurement from compliance activity to strategic advantage.
REFERENCES
- “OKRs vs KPIs: Key Differences Explained.” https://businessmap.io/okr-resources/okr/okr-vs-kpi
- ClearPoint Strategy. “OKRs vs. KPIs: Breaking Down The Difference.” https://www.clearpointstrategy.com/blog/okrs-vs-kpis
- “40+ Manufacturing KPIs & Metrics for 2025.” https://insightsoftware.com/blog/30-manufacturing-kpis-and-metric-examples/
- “OKRs: The ultimate guide to objectives and key results.” https://www.atlassian.com/agile/agile-at-scale/okr
- “OKR vs KPI: What’s the Difference.” https://www.atlassian.com/blog/productivity/okr-vs-kpi
- “78 Essential Manufacturing Metrics and KPIs.” https://www.netsuite.com/portal/resource/articles/erp/manufacturing-kpis-metrics.shtml
- “OKR vs. KPI: Differences, Examples, and Use Cases.” https://www.quantive.com/resources/articles/okrs-vs-kpis
- “OKR vs KPI.” https://www.datalligence.ai/blog/okr-vs-kpi
- Balanced Scorecard Institute. “What is a Strategy Map?” https://balancedscorecard.org/bsc-basics/what-is-a-strategy-map/
- “Common OKR Mistakes and How to Overcome Them.” https://www.perdoo.com/resources/blog/common-okr-mistakes-and-how-to-overcome-them
- “6 Common Mistakes to Avoid When Implementing OKRs.” https://getfrankli.com/knowledge-centre/6-common-mistakes-to-avoid-when-implementing-okrs
- What Matters. “The Difference Between KPIs and OKRs.” https://www.whatmatters.com/resources/difference-between-okr-kpi
- Performance Equation Framework. Based on research from Thomas Gilbert, Carl Binder, Aubrey Daniels, Robert Mager, and Judy Hale showing that 75-85% of performance problems are environmental rather than individual capability issues.
More Articles From Jon Foley
- Supercharging U.S. Manufacturing: 5 Key Ways Trump’s “The Big Beautiful Bill” (OBBBA) Impacts U.S. Manufacturing
- How 100% Bonus Depreciation Supercharges U.S. Manufacturing Under the OBBBA
- Unlock Free Cash: Top Manufacturing Grants You Can’t Ignore in 2025
- Workforce Development Grants and Funding for Manufacturers
- Don’t Just Onboard—Build Capacity: The Process-Based Approach to Resilience and Results in Manufacturing
- Manufacturing Leadership That Transforms: Building True Followership

Jon Foley is a performance improvement consultant and founder of Performance on Purpose, with more than 25 years of experience helping organizations improve results by solving the right problems. Drawing on expertise in behavioral science, systems thinking, workforce performance, and AI strategy, Jon works with manufacturers, public institutions, and Fortune 100 companies to drive measurable, operational impact. His work emphasizes evidence-based leadership, data-driven decision-making, and practical frameworks that translate strategy into execution on the plant floor. Specializing in the Performance Equation Framework.
As a Guest Contributor to Manufacturing International, Jon writes on manufacturing performance, workforce development, KPIs, and AI readiness—helping leaders turn insight into action.
He holds an MS-OPWL from Boise State University and maintains long-standing memberships in ATD and ISPI.

![]()